Crunch Time For SP500 Be Prepared For THIS | Episode 92
Where is the Stock Market Heading?
00:00 Intro
00:30 SP500 and the world’s most watched trendline
02:42 Should you buy the recent SP500 pullback?
06:16 This is how I’m positioned in the SP500
08:46 Why you should watch this key market (and what it’s saying now)
11:11 You won’t believe what this sentiment graph suggests
Transcript
Please note: Charts available from video
This video is going to focus on the S&P 500. I’m going to cover the ASX 200 and gold in a separate video, and I’ll leave a link for that in the description section below. I’ve also got a fascinating graph for you. It’s like nothing you’re expecting, so make sure you stick around for that. As always, this is general commentary and doesn’t take your personal situation into account. With all of that said, let’s get into our first chart.
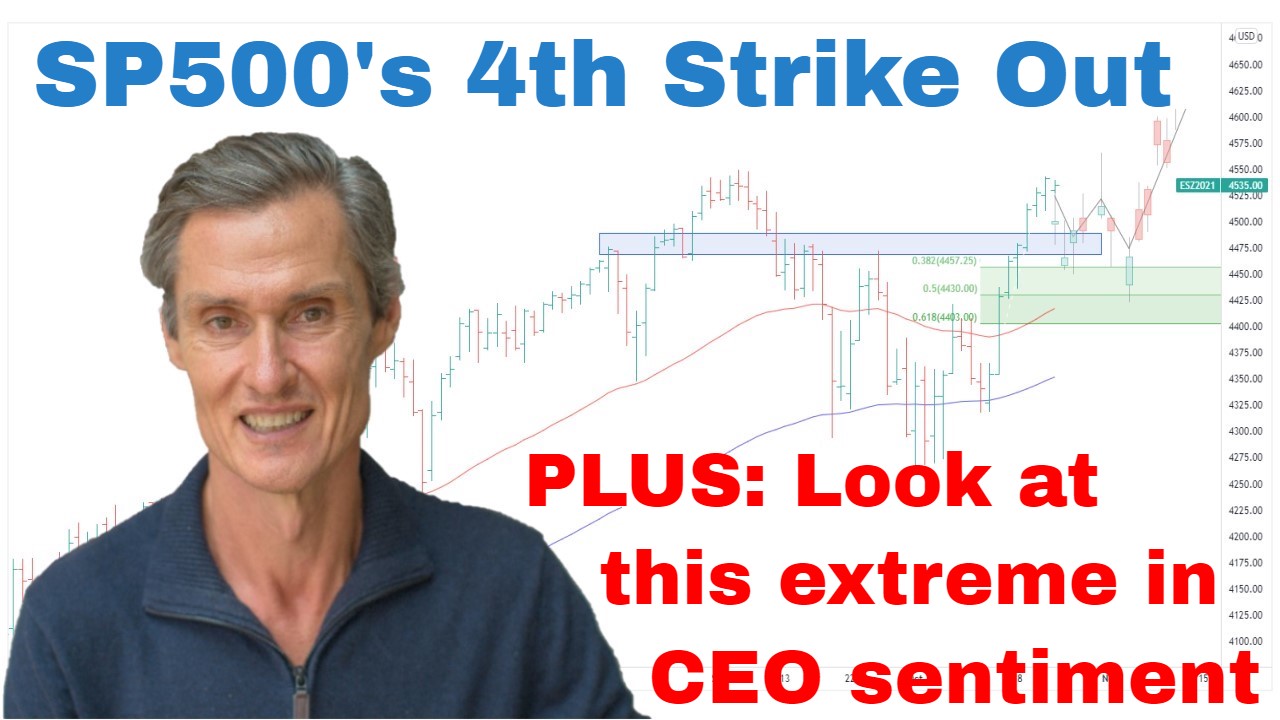
So, we’ve got the S&P 500 up on the screen. And we’ve got to start with what must be the world’s most-watched trend line at this point in time. It’s quite an amazing trend line. Goes back to January where this whole bear market in equities began. And what we’ve had during the week is we’ve had another test of it and another rejection at the trend line. So, it’s now a four-point trend line, which is fairly rare. You don’t usually see these four-point trend lines, so it really is a significant one for us to continue watching. And what I want to do, I want to start over at the four-hourly chart and just get a little bit more idea on the price action over the last week.
So, in last week’s video, I mentioned this little trading range which the market had broken out from. We had this break. So, there’s the trading range. There’s a triangle trading range. We had a breakout last week when Fed Governor Powell talked about maybe slowing up on the interest rate increases, and that potentially set up the possibility for maybe another run up at this trend line, but the run didn’t get too far. The prices hit this trend line and it’s come back down here towards four. So, the strength of that large enduring trend line certainly overwhelmed the potential upside from that small trading pattern. And the market is now back at this support which we’ve spoken about many times over the last few months. Dates back to May. It’s this very technically active region around 39000. And we’re already just getting a rebound off there as I film on Friday afternoon in Sydney.
And so let’s go back to the daily chart. And as you know, for the last couple of weeks, I’ve been talking about this not being a good risk-reward or an asymmetric area to put on new positions in the market, with the S&P 500 being so close to this down trend line. And that remains the case. I just don’t think that where we are now is a point where I’d want to be putting on a new position or even adding to a position in S&P 500. We really are coming down to crunch time for the index where it currently stands in that we are now really wedged between resistance from this down trend line and we have support here at 3900. I wonder whether it’s a case that… There’s two ways this could potentially go, at least two ways. One is the market will continue to coil beneath the down trend line or potentially having another crack at breaking above it. Alternatively, though, and this is probably what people are most fearful of, it’s that we have a repeat of the May and the August episodes where the market started to come down from this trend line and that scenario. The fear would be that the market continued down and made a new low.
So, there are a couple of scenarios which are on the table. I’ll talk a little bit more about that in a moment. We do have support here at 3900. We’ve got the two moving averages. So, we’ve got the 100-day and the 50-day. They haven’t yet crossed. We haven’t got that positive cross yet, but they are continuing to get closer. So, that’s positive for this overall market structure. And the S&P 500 still is above those moving averages. So, they’re positives to the way the market is currently structured, but with the price really wedged in between here… And we have two big events coming out next week. We’ve got the CPI coming out, and we have a Fed meeting towards the end of next week. So, it really does set the stage for some movement really coming up over the next trading week. By this time next week, we’re probably going to get some significant move in either direction of either the support or the downward trend line.
My feeling here is that the… I just don’t think the market is ready to break above this trend line just at the moment. My feeling is that it needs to do more consolidation. It needs to do more work to build up the energy to provide the launching pad to have an attempt at breaking above the trend line. I don’t think it’s going to happen in the early part of next week. It’s going to take at least till we get to that CPI, probably, until we can get a break either way. I still think this could be a large basing pattern that the market is working its way through. But if it is a large basing pattern, it doesn’t mean that the markets got to run now. It’s so much dependent on this data coming up next week.
I’ve still got a position in the S&P 500. You may remember me speaking about this a few times over the last couple of months. I actually looked up the data when I got in before filming. I bought on the 14th of October. So, it was this day here. It was just after the CPI a couple of months ago. And this was the CPI that so many people were fearing was going to crash the market. I’d initially put on a position a little bit earlier, a couple of weeks earlier as we started to rebound after this attempt to break low which failed, put on an S&P 500 position. I actually closed that position a day before the CPI release because I thought there was too much risk. There was a risk that the market really did drop rapidly so I closed it, but then when we got that key reversal day, I put it back on.
And I’ve had it since because as I’ve been saying in these videos, it’s a case of not trying to predict where the market will be but just trying to identify momentum and see where that momentum will take us. And so far, that momentum has taken us a decent distance, and I’m prepared to continue to give that momentum the benefit of the doubt and see whether it can extend further. It’s not about having preconceived ideas that we’ve got to have a recession or we’ve got to have a crash or we’ve got to have anything. I don’t know what we’re going to have. All I do know is that we’ve had momentum, and that momentum is still in place enough to continue giving this the benefit of the doubt. If the price action materially changes, I’ll close the position and we’ll look at other opportunities. But for now, I think there’s enough supporting evidence to say we should maintain long exposure if we have long exposure but not looking to add new long exposure.
Now, if you’re getting some value from this, please hit that like button. Really important if you do that, please. And also, leave a short comment, Just “Hey, thanks for the video.” It tells YouTube people are watching, people are engaging, then YouTube shows more people, and it makes a world of difference to the views I get on this channel. And that’s why I do this, to build up the channel so I can help people understand what I’ve learned from markets over quite a few years of doing this stuff. And also, hit the subscribe button if you haven’t already subscribed. Hit the subscribe and YouTube will give you notifications when I make the videos.
Now, let me quickly show you why I think the odds don’t favor that the market is about to turn on its head and crash at least over the next couple of months. I’m looking at the Dow. You would have seen me talking about this in recent weeks. The Dow remains structurally in a constructive setup. The price is trading above the moving averages. The moving averages are turning higher. The 50-day moving average is above the 100-day moving average. These are the underlying characteristics of a market which is in at least a reasonably healthy state. It’s not a market which is set up to go into a tailspin. The bad stuff happens when the market is below the moving averages.
Now, as we saw here, the market can get below those moving averages reasonably quickly, but at the moment, that’s not the setup. Having said that, it doesn’t look like it’s ready to rip higher either because we have this big resistance band that comes in around 34000, 34500, not a perfect fit. You’ll see there’s overshoots and undershoots all through it, but it’s not meant to be perfect. It’s giving us a region of technical activity. And also, and this is something you remember me talking about in the last couple of weeks, we’re extended above these moving averages. I’ve been saying this for two weeks, and that’s been my reasoning that the market needs to pause and consolidate because remember, we’ve gone 20% in a couple of months. So, a pause in the consolidation is all part of a healthy market. And I think the extension above the moving averages suggests that there’s reason to put some probability on a pause occurring here coinciding with the resistance.
We’ve seen a bit of that over the last week. We have seen a start of the move towards the moving averages. I think there could still be some more to come. It usually takes more than a couple of weeks to correct a 20% rally. So, that’s why I think this market is not ready to break the…well, at least the S&P is why. I think the S&P is not ready to break this trend line yet when I combine it with what’s going on in the Dow. I think there’s more work that needs to be done, but I think it’s worth holding on to long positions as I was talking about.
Now, let me show you something which is really interesting. It’s a sentiment-based graph. Now, this turned up in my Twitter feed during the week. What it’s showing… Some of the data’s come from Goldman, some come from The Conference Board. What it’s showing, CEO business confidence expectations for the economy six months out. It’s a pretty self-explanatory graph. Goes back to 1985, so plenty of data. You can see the low points are all circled. Look at the dates of the low points, and then you project that lower down here to the S&P 500 where it’s got those same low points marked. And you can see the clear pattern that when CEO sentiment about what’s going to happen in the economy in the coming six months gets to an excessively low level, it tends to coincide lows in the market.
I was looking at this graph. I do wonder about the accuracy of this one here. If this is 2000, this doesn’t look like it would be 2002, 2003. I would have thought that would have been more along here. So, I don’t know. Maybe this doesn’t match up properly. This looks more like 2001, which would be here, which would be early. But nonetheless, it’s just worth interesting. It’s worth taking on board and just considering other alternatives to what some of the popular thesis going around at the moment is that things have to get really bad because that seems to be what a lot of people are saying. A lot of people are saying there’s a recession coming, things have to get really bad, and the worse is yet to come. And they could be right. I’m not saying anyone is wrong. I just put this forward, not to make a prediction but to say, “Keep an open mind. Respond to what the market does, not what people say they expect it to do” because as we know, history is full of outcomes that few people thought were likely. And I think we need to approach the market with the expectation that we don’t know, and that we want to respond to what it does rather than try and preempt what we think it might do.
So, let’s leave it there for this week. Thank you for joining me. Hopefully, that gave you a few interesting thoughts to consider. Look forward to talking to you next week.
Please see video for more details analysis and charts
Looking for the best ASX stocks to buy now?
Motion Trader‘s algorithms scan more than 2,000 ASX stocks daily in search of medium term investment trends. We then tell our members precisely when to buy shares. And most importantly, we tell them when to sell.
Try a no obligation FREE 14-day trial of Motion Trader, and see what an algorithmic trading approach could do for you.
Meet Jason

I'm Jason McIntosh, the creator of Motion Trader. My career began in 1991 on the trading floor at Bankers Trust. Nowadays, I trade my own systems from home in Sydney.
Motion Trader is for investors who value robust analysis, data driven entry and exit signals, commentary, and education. I use engineered algorithms to identify when to buy and sell ASX stocks. No biases or guesswork, just data driven signals.