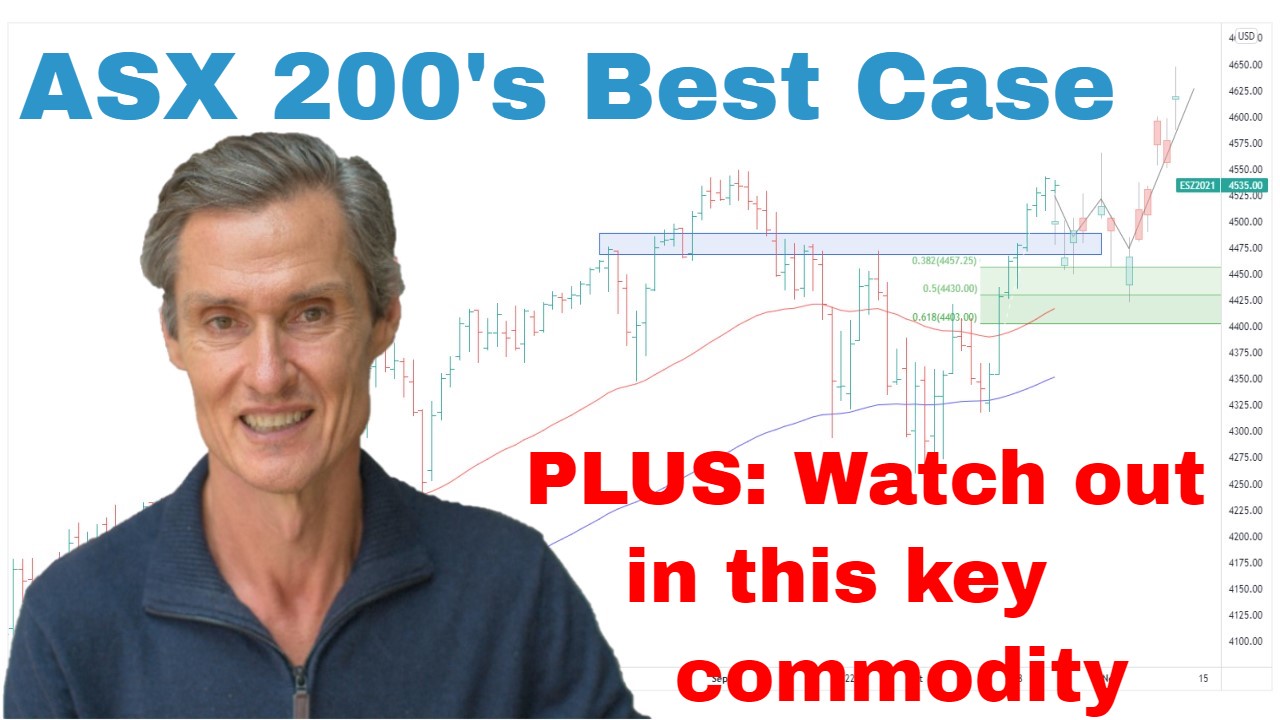
ASX 200s Best Case Scenario | Episode 114
Where is the Stock Market Heading?
00:00 Intro
00:30 Is this the ASX 200’s best case scenario?
03:00 I’m concerned about this part of the market
05:20 Look what’s happened in my portfolio (it’s not all good)
08:30 Is gold bottoming here?
09:14 Watch this key level in copper
10:02 This is how I’ll play uranium
11:52 Oil is coiling up (I think it will break this way)
Transcript
Please note: Charts available from video
This video is going to focus on the ASX 200. I’m also going to have a look at copper, gold, oil, and uranium, so make sure you stick around for that. I’m going to cover the S&P 500 in a separate video, and I’ll leave a link for that in the description section below. As always, this is general commentary. It doesn’t take your personal situation into account. With all of that said, let’s get into our first chart.
So, we’ve got the ASX 200 up on the screen. And this very much remains in corrective mode. I said last week that I didn’t think there was a hurry to do much, and that remains the case. We had an attempt towards the end of last week and early into this week to buy the dip. We talked about, this was a place to buy the dip. We had the moving averages coming through, the Fibonaccis are in there, so this is the shaded area there, the Fibonacci zone. And so that was a natural place to buy the dip. There was that attempt but then the market has now quickly rolled over and fallen quite heavily, particularly on Friday with the ASX 200 being down over 1%.
So, there’s very much a corrective move in place. And I think the best case now would be that this is going to lead to an extended base-building period. And that could really take weeks if not months for some sort of a corrective move to build out, to build some sort of a new base from which we could potentially look for the market to then rally and have a go at this triple top resistance around 7,600. But as I was saying as the market was rallying through January into February, the break of this level is probably going to take some time. It’s a big level and the market needs a strong platform to try and break through there. At the moment, that’s not the case. We’re well and truly into corrective zone.
And what we’ve got here, this area here is the Fibonacci retracement region from this rally from the December low through to the February high. That’s the area I’ve been focusing on over the last few weeks. We’re just looking at the extent of this pullback now and looking at what’s going on in the U.S. Potentially, it’s a case of maybe we should be looking at the retracement of this entire move, so going back to the September low. And if you do the Fibonaccis on the entire move, well, then it opens up targets at lower levels. So, the midpoint then becomes around 7,900, oh, sorry, 6,900. So, there’s plenty more scope for this market to consolidate, this 18% rally over 4 months.
And what is a little bit more concerning to me, I want to go over and have a look at the small ordinaries. Because this price action in the last week or two, it is starting to deteriorate. We have a situation where the moving averages which turned positive in January, and at the time I thought this was quite a positive development for this market where the moving averages turned positive for the first time since back in January 2022, we’re now in a situation where they’re close to crossing back to the downside. And another thing which is concerning is that the price has been sitting beneath the moving averages over the last couple of weeks. And today, on Friday, it’s reacting strongly to the downside just below the moving averages.
So, that’s not a positive setup. It’s a setup which suggests there’s going to be more downside in this market, more corrective price action. We have this support level coming in at around 2,780 thereabouts. This is just one we need to watch. We need to watch, see what happens here. Does this market fall back to the support? Does the support hold? Does it get… Ideally, we want to see the price back above the moving averages. Whilst it’s below the moving averages, it does become vulnerable to further selling. So, just like the ASX 200, I think whatever plays out in the small ordinaries, this could all still be part of a big basing pattern, but it could take many more weeks or months to play out.
So, as I was saying with the ASX 200, I don’t think there’s a hurry to do a lot. It’s a case where I continue to sell stocks from my portfolio where they’re breaking down, where a stop loss has been hit or it’s struggled to do anything for some time and is just treading water. They’re the stocks which I’m looking to exit. And also, I’ve probably got about a third of my portfolio on cash. So, it’s very much taking a conservative, a cautious approach. And we’re just going through one of those periods where I think being extra cautious is worthwhile. There are stocks I’ve got in my portfolio which are still doing well. That’s why I don’t think it’s a case of just sell everything and go to cash.
So, I’ll give you an example. So, this is a stock in my portfolio which I’ve had for several months which is doing well. So, Myer Holdings. Moving averages turned positive in August last year. And this is a sector which a lot of people thought would be a bad one to be in, all this talk of recession, why would you want to buy a retail stock? But the momentum was upwards, so I bought into the stock, and it’s been good. On Thursday, it was up something like 18% on the day and it’s holding up well on Friday in a day. There’s heavy selling. So, some stock is doing well. So, for me, it’s not a case of sell everything and hide completely in cash.
But I’ve also got stocks which I’m exiting. I’ll show you the stock I’m exiting. So, this is a stock called Humm Group. I sold this not long ago, a few days ago. And this is the market we’re in at the moment. It’s a tricky market which is more prone to false breaks because it’s just so much volatility. Momentum is not as consistent as you’d find in an upward-trending market, in a bullish phase of the market. So, I bought a stake in Humm. I think it was in late January as it was breaking higher. We had positive moving averages. It had broken above a November high. It was at its highest level in several months, bought a position. Momentum didn’t stick for long at all. It quickly U-turned and went back down. And so I’ve closed it, I’ve closed the position below the moving averages, hit the stop loss. That’s it. It’s not about hoping for a recovery.
And this is a phase of the cycle we’re in. When things aren’t working, I think it’s best to exit quickly rather than hold and hope, where if a stock is going well, I’m holding on, I’m letting them run. And I think that’s the way to manage risk during this time. People find these stocks frustrating, but as frustrating as they are, they’re a part of the process and we’re more prone to false breaks in this part of the cycle.
So, I think for me, now is the time for being conservative. Volatile corrective periods like we’re currently in, they always lead to these great buying opportunities. We just don’t know when that’s going to be or how long that’s going to take. So, I think the key at the moment is to protect capital, it’s to stay in the game so when the bullish phase does return to the market at some point, you’re still there, you’re still in the game, you’ve still got plenty of capital to play with.
So, now if you’re getting some value from this, please hit that like button. Please leave a short comment, just “Hey, thanks for the video.” It tells YouTube you’re watching and YouTube shows more people. And also hit that subscribe button. Come visit me at Motion Trader, see if what I’m doing could help you with what you are doing managing your portfolio in a pretty difficult period.
Now let’s finish up with some commodities. Just going to have a brief look at gold. It’s been a positive week in the sense that gold started to stabilize. It’s stabilizing around the moving averages, but there’s no upward momentum at this point. It’s just stabilizing. It doesn’t say that we can’t see further selling if we go into a risk-off type of environment. Like with the ASX 200, I don’t think there’s a hurry to do a whole lot. Gold stocks I have which are doing well, I’m happy to hold and try and ride out the pullback, but I’m not interested in trying to buy the dip at the moment in other stocks because it’s just such a volatile setting generally.
Having a look at copper. Copper was looking encouraging last week where we had a strong bounce off this support region at around four dollars. You can just compress this up. You can see this is a significant support region. Also coincides with the moving averages. But I’m just looking at the price action. It’s been coming off with everything else. If the stock market does give way in the U.S., if the support does break, we’d probably see copper break as well. So, all these markets are in a vulnerable position. It’s above support, but let’s just see whether the support holds or whether copper does end up in a larger consolidated phase as well.
Coming across and having a look at uranium. This is this resistance point we pointed out a few weeks ago on the ETF, the Sprott Physical Uranium ETF. It comes in at around $17.50. I want to play uranium from the upside, but I don’t want to buy anything which is just sitting below a resistance point when the market is going into a… Looks like it could be going into a volatile and vulnerable phase. So, I continue to watch this. I want to buy a breakout. I don’t want to buy just sitting below resistance.
And on that note, Cameco, the big Canadian listed uranium producer. I spoke about this a few weeks ago. Big triangle trading range which Cameco is trading in. I think this looks like a really interesting setup in that we’ve had the big rally from back in 2020, the big rally, we’ve had the big consolidation which has gone on for…coming up close to a year now. The moving averages are positive, but as I was saying a couple of weeks ago, I didn’t want to suggest buying Cameco whilst it was just below resistance, just like uranium is now. These resistance points, they actually do provide resistance a lot of time. You get supply coming into the market, and that’s what’s happened in Cameco. It’s pulled back. So, I want to buy the breakout. I don’t like to preempt breakouts. I’ve learned many times over many years, preempting breakouts often leads to trouble and, yeah, you end up in a stock which pulls back. So, continue to watch uranium with a lot of interest. I continue to watch Cameco with a lot of interest, but I want to be patient. I want to wait for the breakout at the moment. There’s just nothing to do.
Now, just finishing up, I’m going to have a quick look at oil. Haven’t spoken about oil for a while. But this is another market in a vulnerable position. So, we’ve had this big sell-off from June 2022. From December, we’ve moved into a sideways trading range. But look at the moving averages. The moving averages are still declining. These are the 50 and the 100-day moving averages. Oil’s just been tracking sideways below these averages. Looks like it could be starting to break down. What we can do, we can put on a bit of a flagging formation. Let’s just draw this in. So, we’ve got this… There are several ways you can try and draw a pattern around this price action. One is to say, this is a flagging formation, and we’ve had a move down, we’ve had a flagging formation, and it’s setting up for another move lower.
So, that’s interesting in itself. Why would… And this oil, of course, hasn’t broken down yet. Maybe it doesn’t. Maybe it find support here and potentially rallies. We don’t know. Let’s wait and see what the price action does. If it did break down, do we say, well, lower oil is good for inflation so that actually could support the market, or is it breaking down because global growth is slowing and that’s going to be bad for the market? I don’t know the answer to that, but it’s just, how is all this going to fit into this giant jigsaw puzzle we’re constantly trying to put together? So, interesting things happening. If you have energy stocks, oil stocks, be aware that there could be a breakdown and it could see a decent sell-off. it may not happen. Just saying to be aware of its possibility, not this is going to happen. It’s a possibility. So, lots going on in these markets.
Let’s leave it there for this week. Hopefully, that’s been interesting. Hopefully, you get something to think about from that. Please give me that like, and I look forward to coming back and talking to you again next week. Until then, bye for now.
Please see video for more detailed analysis and charts
Looking for the best ASX stocks to buy now?
Motion Trader‘s algorithms scan more than 2,000 ASX stocks daily in search of medium term investment trends. We then tell our members precisely when to buy shares. And most importantly, we tell them when to sell.
Try a no obligation FREE 14-day trial of Motion Trader, and see what an algorithmic trading approach could do for you.
Meet Jason

I'm Jason McIntosh, the creator of Motion Trader. My career began in 1991 on the trading floor at Bankers Trust. Nowadays, I trade my own systems from home in Sydney.
Motion Trader is for investors who value robust analysis, data driven entry and exit signals, commentary, and education. I use engineered algorithms to identify when to buy and sell ASX stocks. No biases or guesswork, just data driven signals.