ASX 200 Set To Fall Further | Episode 107
Where is the Stock Market Heading?
00:00 Intro
00:30 How far could the ASX200 fall?
03:07 Watch for this key price action in ASX200
05:32 Small Ordinaries near support
06:04 Don’t be in a hurry to do this
07:00 Look what happened to my portfolio
09:22 Gold finally pulls back (this is what I’m doing)
12:24 Could copper do this next?
13:43 This is the asymmetric play in uranium
Transcript
Please note: Charts available from video
This video is going to focus on the ASX 200. I’m also going to look at the latest developments in gold, copper, and uranium, so make sure you stick around for that. I’m going to cover the S&P 500 in a separate video, and I’ll leave a link for that in the description section below. As always, this is general commentary and doesn’t take your personal situation into account. With all of that said, let’s get into our first chart.
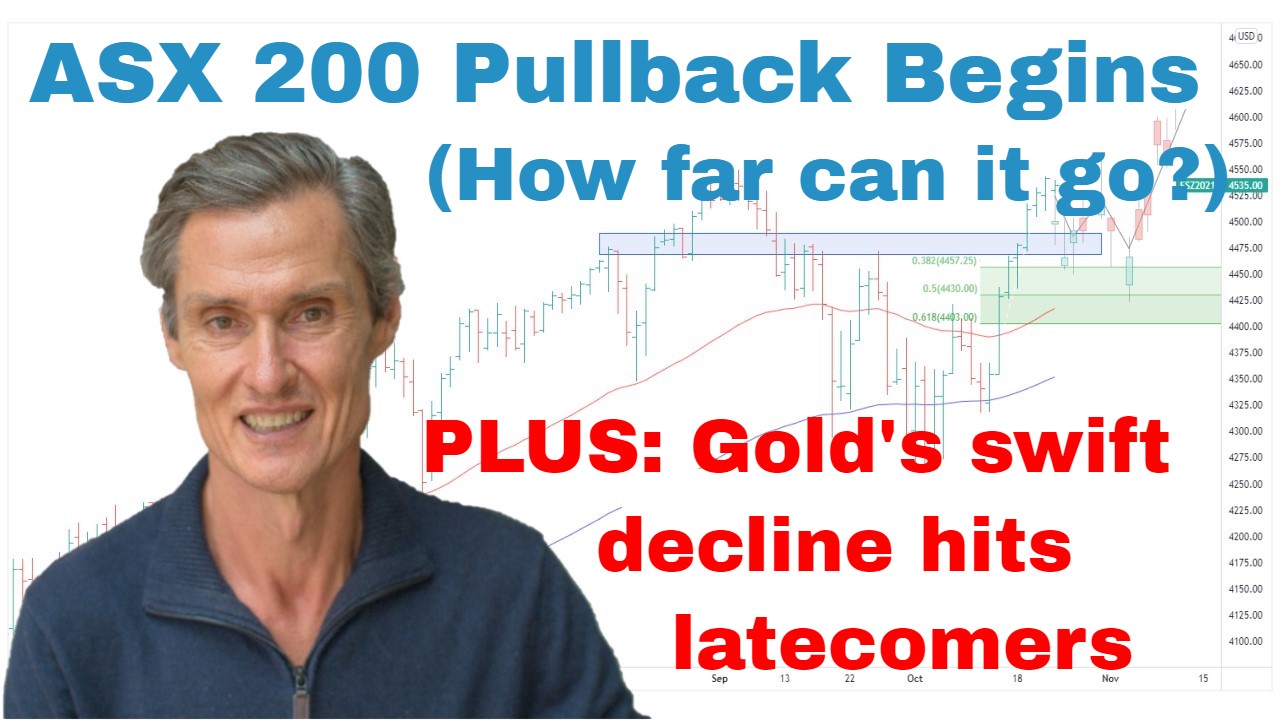
So, I’ve got the ASX 200 up on the screen. And it’s been an interesting week. The pullback that we’ve been discussing, or I should say the potential of a pullback that we’ve been discussing over the last several weeks, now seems to be underway. And we’ve had this situation where the ASX 200 was just getting so stretched above these moving averages. So, I’m looking at the 50 and the 100-day moving average. Quite often, when a market gets so stretched above those averages, it tends to pause and pull back towards them. And it’s simply a case that every rally needs to get checked by a period of consolidation. And I think that’s probably what we’re now seeing occur in the ASX 200. So, the question now is, where could this pull back to?
So, one thing we can do, in terms of trying to identify a potential pullback point, is to use Fibonacci retracements. So, to do this, I’m going to use the low point from the most recent advance to the high. And we get this Fibonacci region, which comes in at around 7300, just below 7300. So, that becomes a bit of a natural target point for the market to pull back to.
And you might be thinking, “We’re still a bit above there. Could it really come back that far? Interesting just to look at this previous period. Just move the scale of the chart, so I can draw this in. And looking at this previous period, from the low point to the high point. And you can see how the ASX 200 came back first to the top of the region, of the Fib region, and then it came back to the 50% mark. So, it doesn’t always work out like that by any stretch, but it’s a good approximation, and it works quite well in giving ideas. And the other point to note about the Fib region, it also coincides with roughly where these moving averages currently are. So, they’re going to move a little bit over time, but a pullback towards this region would also bring the market back towards the moving averages, which again is quite a common thing that you see in a rising market. You get these retests of the averages, and you get another rally.
And I think what this pullback looks like is going to be really important in terms of gauging where… Can this market continue to rise over the next several months? So, what we want to really see happen here, as the market comes back, we want to see buyers step up, and we want to see accumulation happening. And if we get that, then that could create the platform for a retest of this next resistance band. So, ideally, what we’d see would be something like who knows how this is going to develop, but a consolidation that look like that could then set the platform for a retest of this resistance, which is up at around 7600, that being a triple top, and also marking the all-time high in the ASX 200.
Interesting just to go back to a previous period. These things never play out the same way, but just gives you an idea of the price action, which I’m thinking is possible. So, just looking this period through here, it’s also a triple top, one, two, three triple top resistance, market pulled back, market ran up towards it, stalled, pulled back, and then from there, it was able to punch through. So, that’s not dissimilar to the price action that we have now in that we’ve got the triple top, the markets pulled back, the markets run back up towards the resistance. Now we’re going to see what happens, what pullback do we get? Of course, this could start to unravel. Maybe it continues down to a new low. That’s not the setup at the moment, but we don’t know. We’ve got to wait and see how it develops. But the positive price action would see the market move sideways, perhaps sideways lower, build up a platform for maybe a retest of those highs. But as I say, we need to see how the price action develops.
And as I said last week, pullbacks aren’t necessarily a bad thing. They keep a market in balance, and they stop it from getting overheated. A bit like breathing. You got to inhale, you got to exhale. You got to do both. You just can’t keep going one way. Market is the same. We’ve done a big inhale, now we’ve just got to exhale, and we can, hopefully, see the market take another leg.
And moving on to the small ordinaries. Just taking a brief look at the small ords this week. It’s a similar story. The small ords has… Last week, we were talking about the small ordinaries had started to pull back, and it’s continued that through the week. It’s now back to these moving averages, back to the 50 and 100-day moving averages. Putting on some Fibonaccis. Give an idea where we are. We’re back at around the 50%. It’d be good to see some support starting to come in for the small stocks around here.
I think the way this market is now set up, both the ASX 200 and the small ords, I think the way it’s set up, I think we can be patient. I think investors can be patient in both buying and then selling. I don’t think there’s a rush to buy stocks at the moment with the markets pulling back. We want to see how the pullbacks develop, but then I don’t think there’s also a rush to sell because this could well be an advance, it could be a consolidation before another leg higher. So, that’s why I think we don’t want to be in a hurry to sell unless, of course, stocks are coming back to exit points where they need to be sold. If a stock has become weak to the point where it’s past the level, which it should be held, a stock, of course, should be sold. But if a stock has been generally trading upwards, and is having a modest pullback, I’m inclined to hold those stocks. I got to sit through. You’ve got to sit through consolidations to stay on larger trends.
And I’m still long the market. I’m still seeing good gains across my portfolio. I’ll show you what I mean with my portfolio. This is from my website. On the homepage of my website, you can see my own portfolio, my Motion Trader portfolio, which is my own money, my real-money portfolio. And it’s tracked by this software. This is really good software. It’s called Navexa. It’s portfolio management software, and it’s all done online. You don’t need to download anything. It’s all done through the Navexa website. And it’s great because I enter my trades, or my trades can be uploaded automatically from my broker. And I’d rank this from best stock down to worse. So, you can see the performance. These are the stock codes. My stocks tend to be small to mid-caps. I focus at the smaller end of the market. And a lot of these stocks have been put on over the last maybe six to nine months.
So, you can see the gain, which I’ve gotten over that period. Just scrolling down the table. A lot of stuff in that mid-40 range. And I hold up to 80 stocks. I have quite a few stocks. And then, of course, you get into the losses because it’s not all wins. You’ve got the losses there as well. And again, that’s what we use risk management for. But these losses are moderate. They’re within the tolerance level of where I hold. And then we go down. The worst performer is 23%. That’s getting to the exit point. You can see there’s nothing below there because I’m cutting losses. I’m running the winners. So, you can see I’ve got those big gains up around 100%, but then I’m cutting losses. So, nothing really gets much below that 25% mark. So, yeah.
And then you can see there is my portfolio, there is my real-money portfolio going back to October 2015. This is accumulated profits. So, in the last seven months, it’s gone from, what, say $680,000 to $740,000. There’s 60 grand in the last 6, 7 months. So, that’s what’s been going on in my portfolio. So, it’s a case of letting those profits run, and then using those risk management strategies to exit those stocks that are lagging.
Okay. So, let’s get over to the commodities. But first of all, if you’re getting some value from this, please hit that like button, please leave a short comment, just “Hey, thanks for the video.” It just tells YouTube people are watching, and YouTube will keep showing people my videos, which helps me so much. So, please do that. And hit the subscribe button if you haven’t already, and come over to Motion Trader and have a close look around what I’m doing with my portfolio, and they’re all, of course, Motion Trader stocks, stocks which a lot of my members are holding as well. Come see what I do. Might be able to help with what you are doing.
Now, enough about that. And let’s get into some commentary on gold. So, it’s taken a few more weeks than I thought, but we’re finally getting that pullback which was… It’s always inevitable. When a market gets stretched above the moving averages, it’s a matter of time before it just comes back and retests it. And when it happens in gold, it is often swift. And gold didn’t disappoint this time around. We had gold’s typical swift pullback towards the moving averages. And that’s why I’ve been suggesting some caution over the last few weeks as we had this slow grind high, this overlap price action in gold. It was a sign that it was running out of steam, and we were due for a pullback. And that’s why I said just, for me, it was a case of holding what I had, but not rushing out to buy a whole lot of new stuff because there was a high probability, at least in my view, that that price action was coming.
And it’s funny when a market is rising you feel like you’ve never got enough, and you always are, “I wish I’d bought some more on the way up.” But then as soon as it pulls back, often you think, “Geez, I wish I didn’t have so much.” So, it’s just the way markets are. We’ve got to remember when markets are high and chugging along nicely that they will pull back, and we don’t want to feel we have too much. So, being conservative. Not getting greedy as the market is running. You want to be able to hold on during the pullbacks. Not have a top-heavy position, and get shaken out.
The indicator that I was using during that period was the rate of change. This is just a handy one just to keep an eye on for your own reference when you’re looking at stuff because we’ve got that really nice divergence. We had the price going up, but the rate of change just kept deteriorating. It was a sign that gold was losing momentum. It doesn’t always play out like this, but it’s just one of those indicators, which is nice to be aware of and to be able to keep an eye on. A lot of the time it’s not relevant at all. You’re just looking for the periods where you can get that divergence either bullish or bearish. It can help you around how you manage your portfolio.
Okay. So, let’s go on and have a look at copper. So, copper this week continues to pull back. We’re talking about last week we had the pullback underway. The same story, stretched above the moving averages, pulling back towards them. Now getting pretty close to those moving averages. Also, coming up to this support around four dollars.
For me, we had this strong upward move during January. It just may take more time. Price-wise, the pullback looks fine. We’ve come to the top of the averages, but I’m just not in a hurry to go out and do much in this. Maybe we’re going to get another period like this that we had during November where the price moved sideways. We had a strong advance, we had a sideways movement, built a platform to launch higher from. Maybe we get something similar to that where the price moves sideways. Provides a launching pad for another move higher. I don’t know how it’s going to play out. I like the overall structure when we step back and we get some more data from the 2020 low. It does look like we’ve had this big corrective move. Got a rounding base. Looks constructive overall medium term, but how this plays out in the near term over the next few weeks, I don’t know, next few months even. So, let’s just continue to watch how this price action develops.
And lastly, just jumping to uranium. It’s been one of the stronger performing commodities over the last few weeks. Let me just throw some moving averages on. We had a pullback towards the moving averages last week, got a quick buy the dip, market ran higher again. But the timing of all this is like I think, I want to play this. I think the asymmetric play is to the upside in uranium, but we don’t know the timing. This sideways consolidation could drag out for months. We just don’t know. We don’t know when. Of course, we don’t know if it’s going to break to the top side, but when we get signs of strength, I want to be playing it from the upside. Maybe we’re going to get some consolidation if we get a general pullback in commodities over the next few weeks. But I think the overall structure continues to remain good, remains encouraging. So, that’s where I want to be playing uranium, from the upside.
So, let’s leave it there for this week. Let’s call that a wrap. Hopefully, it’s been helpful and interesting, and thank you for joining me. Give me a like, and I look forward to talking to you again next week. Until then, bye for now.
Please see video for more details analysis and charts
Looking for the best ASX stocks to buy now?
Motion Trader‘s algorithms scan more than 2,000 ASX stocks daily in search of medium term investment trends. We then tell our members precisely when to buy shares. And most importantly, we tell them when to sell.
Meet Jason

I'm Jason McIntosh, the creator of Motion Trader. My career began in 1991 on the trading floor at Bankers Trust. Nowadays, I trade my own systems from home in Sydney.
Motion Trader is for investors who value robust analysis, data driven entry and exit signals, commentary, and education. I use engineered algorithms to identify when to buy and sell ASX stocks. No biases or guesswork, just data driven signals.