

Hi, I'm Jason McIntosh, the creator of Motion Trader. My career began in 1991 on the trading floor at Bankers Trust. Nowadays, I trade my own systems from home in Sydney.
Motion Trader is for investors who value robust analysis, data driven entry and exit signals, commentary, and education. I use engineered algorithms to identify when to buy and sell ASX stocks. No biases or guesswork, just data driven signals.
Beware: What Stocks Do Next Could Blindside You (don't be this guy)

I’ve never seen anything like it…
From an all-time high on 12 February, the Dow Jones fell for 21 out of 28 days. It was virtually one-way traffic. The market didn’t register consecutive up-days during the entire fall.
Then, from a point of extreme fear, stocks rallied…
Up 11.4%, up 2.4%, up 6.4%.
In a blink of an eye, the Dow put on an historic 3,960 points, or 21.3%. This is the biggest three-day surge since 1931. It also includes the largest single-day points rise ever.
Many people look for this type of advance. They believe it signals a major low is in place. And they scurry to buy into the market before prices rise any further.
But often it’s a trap.
You see, most bear markets include a series of strong rallies. These periodic uplifts often provide a false sense of hope before the market once again turns lower.
I’m going to talk more about bear market rallies in a moment. These are one of the most deceptive features of the market cycle. And they separate many people from their money.
But first, I’ve got something to show you.
Ask Google
Perhaps like you, I get much of my news from the ABC.
My favourite section is Alan Kohler’s business report. In addition to providing a good summary of the day’s action, he often finishes the segment with an interesting graph.
And his recent updates have been no exception…
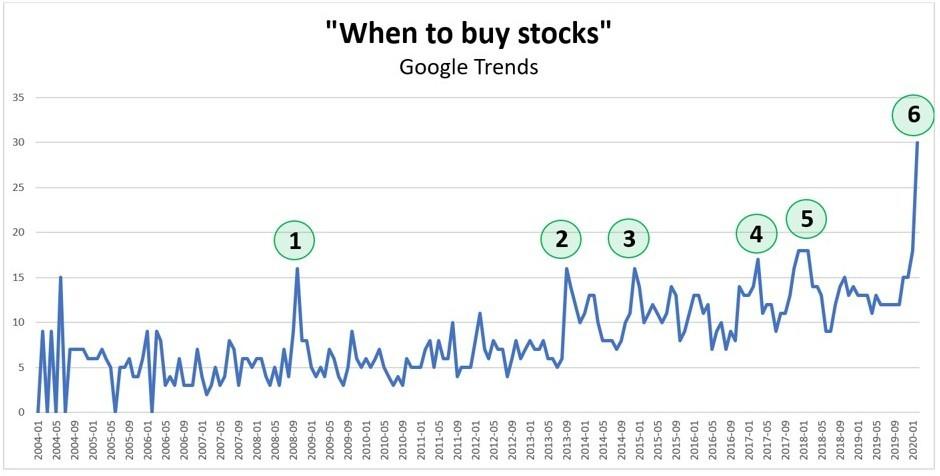
Alan recently presented a graph I hadn’t seen before. It was for Google searches with the phrase “how to buy stocks”. The level of interest AFTER the crash was at record levels.
I jumped onto Google to check for myself. The phrase I put in was “when to buy stocks” — a slight variation to Alan’s search. You can try for yourself by looking up Google Trends.
Here’s what came up:
Now, let me explain…
The data for the graph is from Google. I’ve added the numbering and the titles.
You’ll see a spike higher at the end of the chart. This was for searches for those key words. It was the biggest surge in interest since Google began compiling records.
What is this telling us?
Well, I did some analysis to see what was happening at the previous spikes. These are numbered on the chart. The aim was to see if there was a pattern that could help now.
Here’s what I found:
- October 2008: Steepest part of the GFC decline. Five months before the bottom.
- September 2013: Stocks made a new all-time high after 5% correction.
- December 2014: 5% correction before a new all-time high.
- March 2017: 4% correction ahead of new all-time high.
- December 2018: The month before a 12% correction.
- This year’s data after the crash from an all-time high.
The most interesting thing for me isn’t what I see… it’s what I don’t see.
Do you know what that is?
None of these spikes identify a major turning point.
Now, I don’t expect this data will help in pinpointing the low. While the graph is interesting, there are only a few key data points to analyse… not enough to gain high confidence.
But it does indicate a lot of interest in the market.
Why is this a concern?
Well, bear markets typically bottom on either:
- Maximum fear, or
- Complete disinterest
Google Trends suggests to me that either condition could take time to develop. I believe this raises the prospect of bear market rallies. New lows are a distinct possibility.
So, why should you be wary of bear market rallies?
Let’s look at that now.
Bull traps
Consider the most notorious bear market of them all…
After crashing 45% in 1929, the Dow rallied 47% over four months.
But it wasn’t a new bull market — it was a bear market rally.
Stocks ultimately fell by a total of 89.2%. Woven into the decline were monthly gains of 8%, 9%, 12%, and 14%. There were also multi-month rallies of 15%, 23%, 26%, 34%, and 25%.
This is what it looks like on a chart:
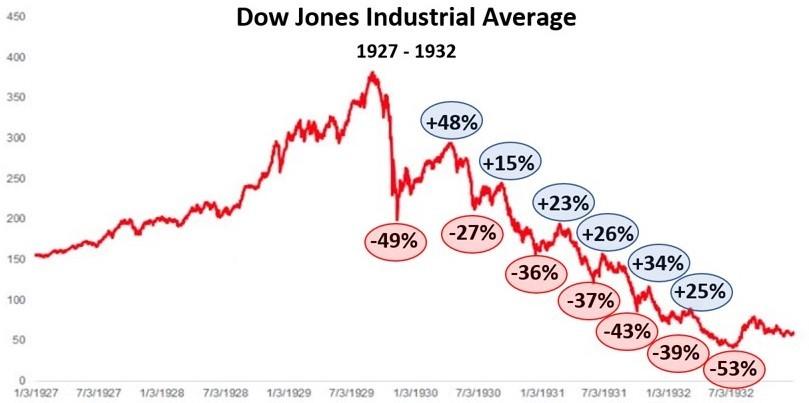
By the time it was over, few people would have been asking: When to buy stocks?
The general mood at the bottom was complete disinterest. Many investors had lost everything, and those still standing were likely worrying about yet another decline.
Now, I’m not predicting we’ll see a repeat of 1929 to 1932. Every bear market is unique in size, duration, and the course it takes. While they have similarities, no two are the same.
The point of this isn’t to alarm you.
Rather, it’s to show the deceptive nature of bear market rallies.
You’ll only know the final low in hindsight.
Here’s a more recent example of major bear market:
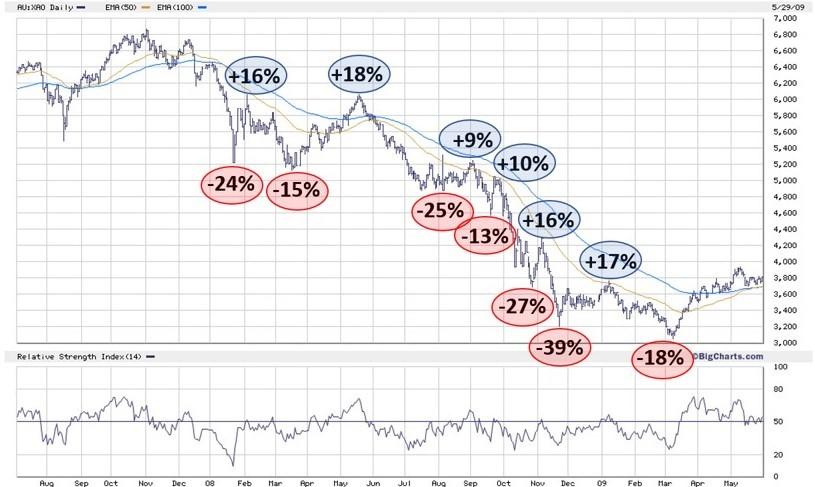
This is the All Ordinaries during the global financial crisis (GFC). It shows the market at both its peak and the eventual low. I’ve marked some of the key rises and falls within the decline.
Now, have a look at the rallies…
Up 16%, up 18%, up 9%, up 10%, 16%, up 17%.
Any of these could have been an emerging bull market. But they weren’t.
And that’s what makes these periods so hard.
While a bear market rally may look and feel like the real thing, it’s not. The market eventually gives back all the gains. That’s why rushing in at the first sign of strength is risky.
Another difficulty relates to emotions.
You see, a sharp rally often causes FOMO, or the fear of missing out. Many people see prices rising and hurry to buy themselves. Their buying is often emotional, not strategic.
And as you know, markets aren’t the place for emotions.
I’m seeing all sorts of predictions about what the markets will do next. Some people believe the low is already in, while others say that a cataclysmic crash is just beginning.
Which camp is right?
Probably neither. The outcome is likely in the big grey area between the two.
Here are some possibilities…
Past and present
Every bear market is unique.
This means there’s no playbook for timing the low.
Some sell-offs are relatively short, while others drag on.
I saw a fascinating image recently. It’s by the analysts at Of Dollars And Data. It shows the nine times since 1915 that the Dow Jones has fallen by more than 30%.
Check this out:
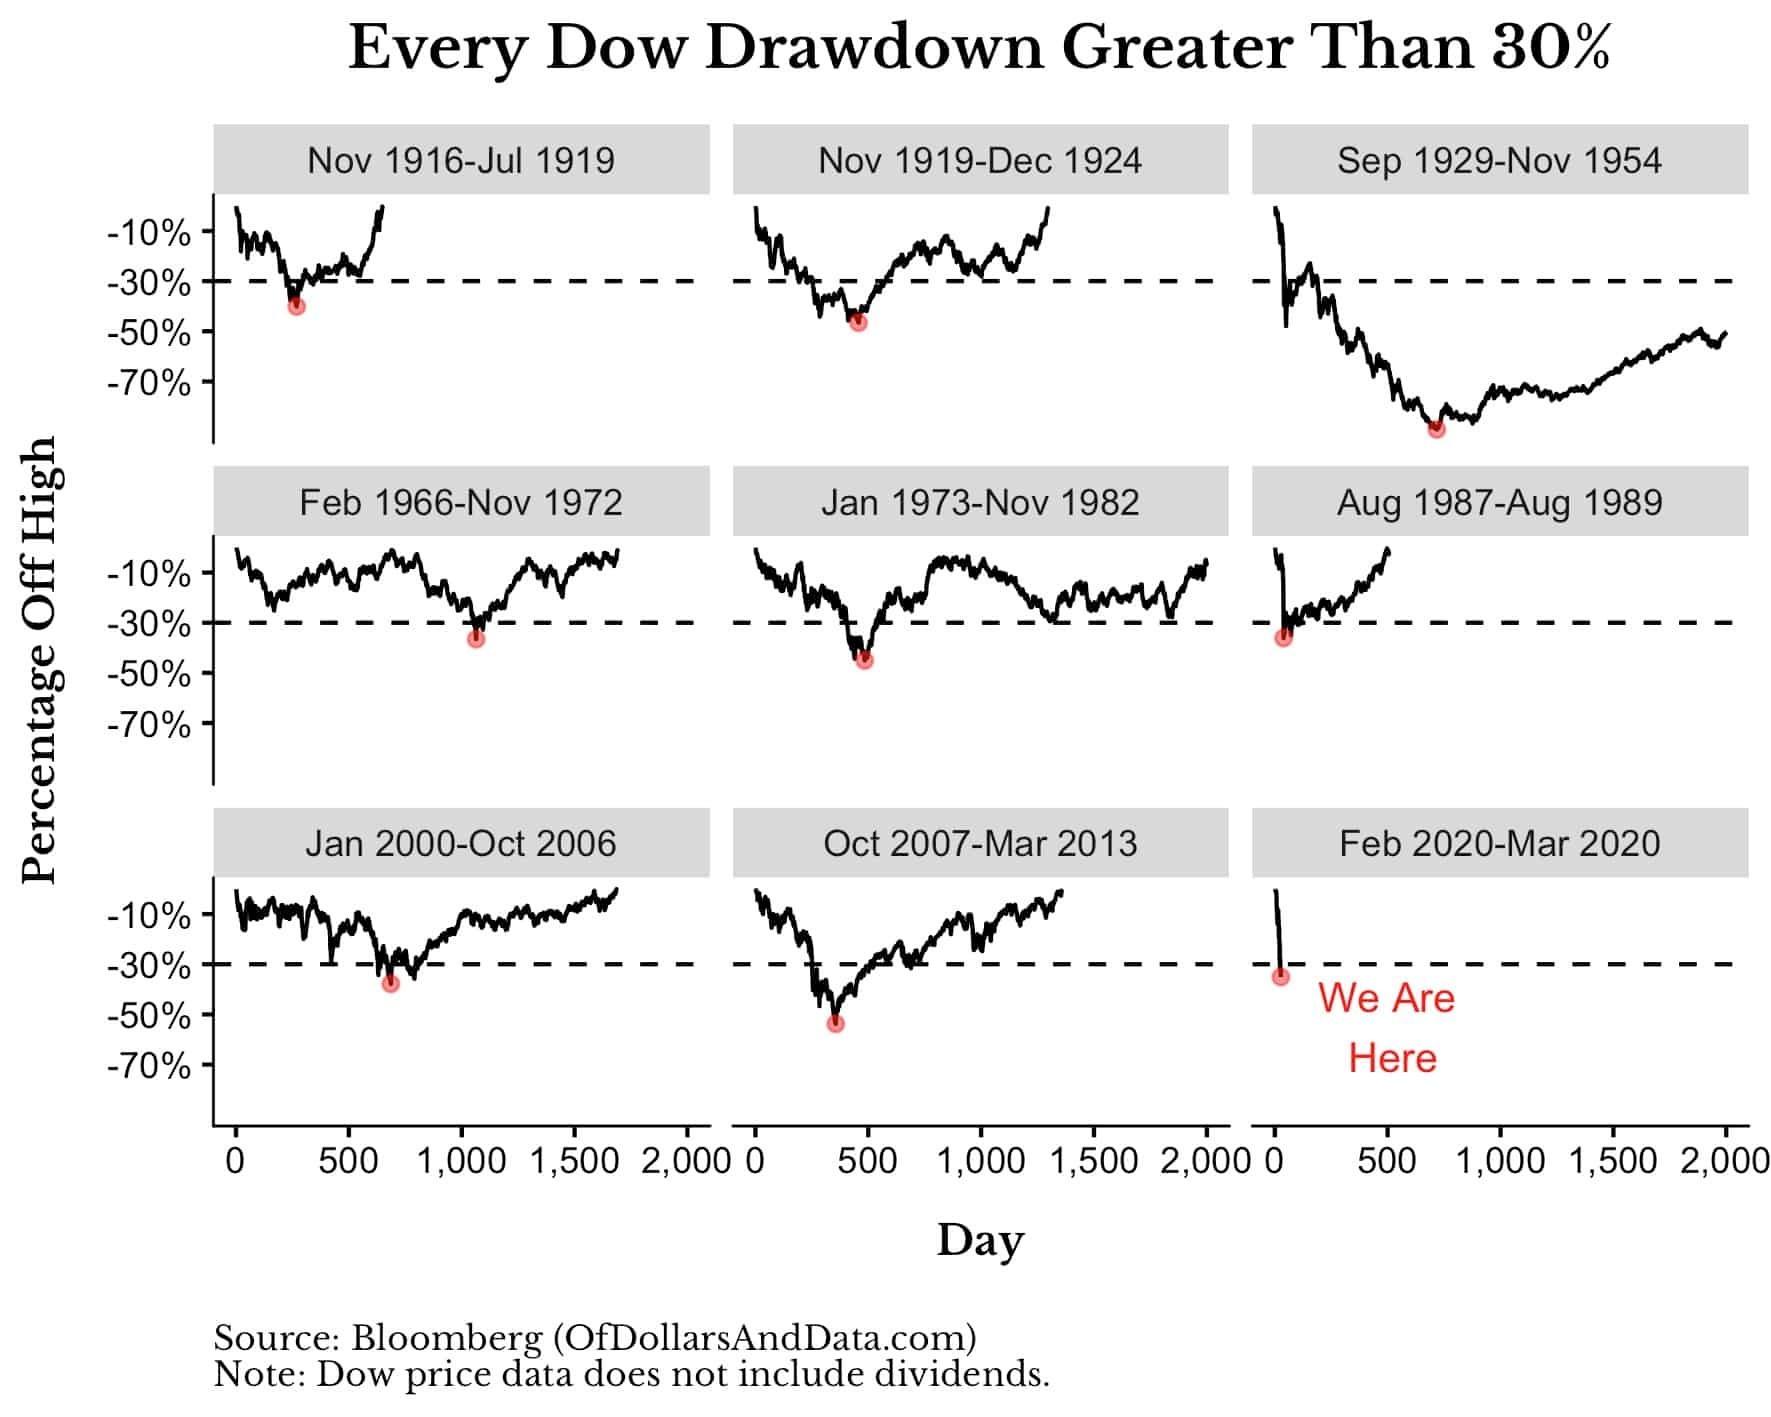
This brings some perspective to the COVID crash.
It’s been super fast on the way down. Only two of the other big bear markets began with the same sort of aggressive selling. These were the crashes of 1987 and 1929.
The next thing to look at are the recoveries.
History shows that the market eventually rose well above the old highs.
In this sense, every bear market was an amazing buying opportunity. I don’t expect this time to be any different. People will almost certainly look back and say: “I wish I got in”.
But look how long it could take…
The quickest recovery was from the 1917 low, which took 19 months.
After that, it was the bullish period following the 1987 crash.
Interestingly, the period from 1919-24 includes the Spanish Flu outbreak. Stocks fell by over 40% during this time. And it took three years and four months to return to the old highs.
Anyone thinking the current situation will resolve quickly is betting against history.
But… and it’s a positive but…
In each of the bear markets, there were lots of opportunities AFTER the lows.
It wasn’t necessary to buy within a few days of the bottom. A strategy to invest as the trend was rising could have got into each recovery — well before the market made a new high.
The key is to have a plan to:
1. Identify when to get you into the market, and
2. Know when to get you got if you’re timing is off.
So how do you do that?
Let’s look at that now…
Buyer’s remorse
You’ll be familiar with words “buy low, sell high”. It’s probably the most famous stock market saying of all time. Few other phrases have as much cut through.
The tricky part is defining what’s “low” and what’s “high”.
Many believe that buying low means to buy straight after a big fall. They say this is how you get a bargain. Their overriding aim is to lock in a discount before prices rise.
Others are a little more patient…
Rather than pre-empt the low point, these people wait for early signs of strength. Often it only takes a one or two day rally to get their interest. They’ll then buy at the first opportunity.
But rushing in can be risky.
You see, stocks in a downtrend also experience periods of rising prices. And sometimes, these rallies can be very strong. Many people mistake these for the start of a new uptrend.
Let me show you what I do…
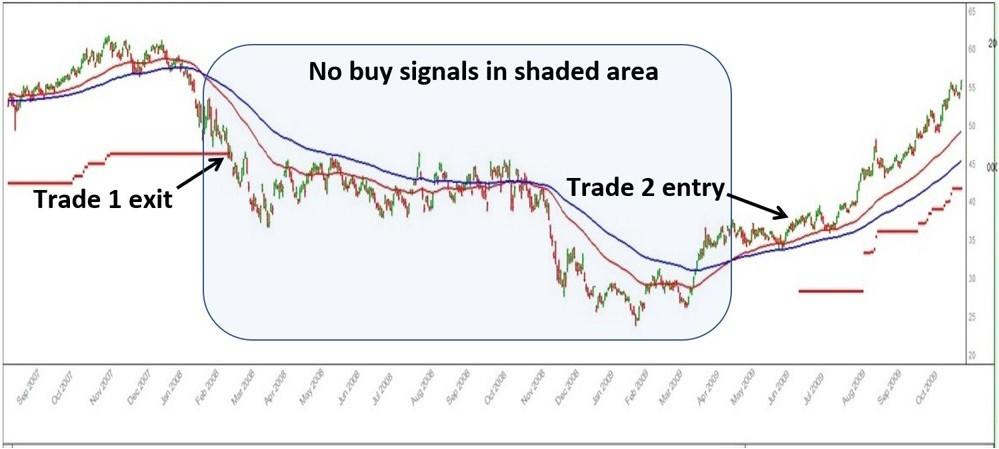
The graph shows two hypothetical trades in Commonwealth Bank [ASX:CBA]. It covers the period from August 2007 to November 2009 — similar to the earlier chart of the All Ords.
Trade 1 is an exit. CBA hits its trailing stop after the market turns lower. The exit protects capital from further share price falls. This is like what happened during March.
Now, have a look at the moving averages (the red and blue lines)…
They turn lower. This means there can’t be any buy signals.
Do you remember all those bear market rallies on the earlier chart?
They were during the shaded area on the graph. If you were using a similar approach to what I use for entries, you would not have been a buyer during this period.
Have a look at all CBA’s rallies throughout the decline…
There were many buyers at each surge higher. Some were likely thinking that a major low was in place, and that CBA was a bargain. And for a few days or weeks, prices rose.
But the ultimate result was a new low. This is the risk of buying early.
That brings us to the second trade: An entry.
Now the approach I use will never catch the low — it’s not possible.
But what it can do is help you avoid many of the false starts.
Here’s another chart for CBA:
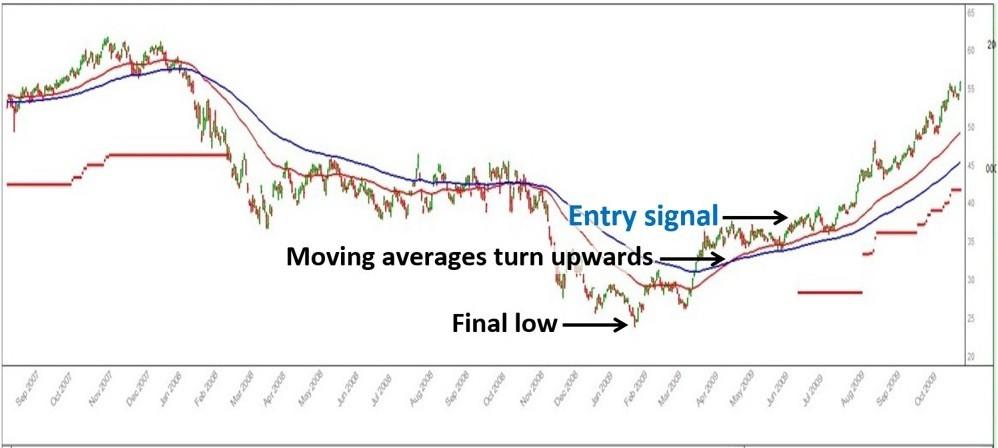
This time I’ve highlighted the entry.
CBA makes a final low on 23 January 2009.
The rally initially looks like another bear market advance. Prices push higher and then begin to roll over again. It’s a pattern that had been playing out for months.
But this time was different…
Rather than making a new low, the shares rally. This starts to feed through to the moving averages. They begin to turn upwards, indicating a potential trend change.
With conditions improving, I got a buy signal on 10 June.
Some people will say this approach gets in late. They’ll point out that CBA was well off its lows when the entry signal occurs. They’ll add that getting in sooner is more profitable.
All this is true.
But if you get in earlier, you’ll likely also buy into several bear market rallies. That’s the almost inevitable consequence of moving quickly to catch the low.
Now, it’s important to understand that no approach guarantees success. A stock could have rising moving averages and then quickly reverse course.
While my strategies had success with CBA, this won’t always be the case. The current situation will playout in its own unique way. We’ll only know the ideal moves in hindsight.
The fact is that making money in these times (and keeping it) is hard.
Sure, some people will be lucky and buy just before a rally.
But what then?
Do they quickly take profit or hold?
And if they hold, what do they do if the stock falls to a new low?
The truth is that there are no simple answers.
Now, an important point: I’m writing this from a medium term perspective. If you have both the time and skill, then it’s possible to profit from bear market rallies.
But short term trading is a different game.
My approach is targeting trends with medium term potential. I’ve formulated my entry criteria to seek out stocks that could rally for 12 months, not 12 days.
Think of it this: Marathon runners don’t take their cues from the sprinters. If you’re running 42.2 km, you’ll have a different approach to those who scamper down the 100m track.
Likewise with investing, if your goal is to hold shares for upwards of a year, then don’t focus on short term price swings. These are best left to people specialising in that area.
I believe the right approach is to use a strategy that you’re comfortable with, and that has a history of success. It’s then a case of following that method consistently.
Opportunities will surely emerge from this period. I expect there’ll be many great buys in the months ahead. It’s a matter of knowing when the right indicators to line up.
Know what to do, and when...
If you’d like to learn more about my approach, I’m about to host an online skills accelerator class. It will explain my strategies in detail, and I’ll show you how to use them yourself.
This is a FREE online event, and I’d like you to be my guest.
You’ll learn 5 critical investment strategies. These will help protect your capital in the bear market, and prepare you for opportunities on the other side.
These were true game changers for my career. And they could transform your portfolio in ways you can’t imagine. Many people have little knowledge of this process.
And one more thing, I’m not just going to teach you, I’m going to show you.
You’re going to see actual trades from my own portfolio.
And to be clear, this isn’t just some pie in the sky theory, it’s a real life process that I use myself — a process that could completely change the way you invest.
I just know you’ll get a lot of value from this event.
Save your virtual seat today.
IMPORTANT NOTICE: The material on this page is general in nature. It does not constitute personal investment advice or personal trading advice. Any advice provided is general advice only and does not take into account an individual’s risk profile or financial situation. Trading involves the risk of loss as well as the potential of profit. You should seek independent financial advice in deciding if trading is appropriate for you. Please also consider the appropriateness of the advice in light of your own objectives, financial situation or needs. As always, past performance is not indicative of future performance. Please see Financial Services Guide below. Jason McIntosh is an Authorised Representative (AR No. 1274211) and Motion Trader Pty Ltd is a Corporate Authorised Representative (CAR No. 1274210) of Shartru Wealth Management Pty Ltd ABN 46 158 536 871, AFSL 422409.
