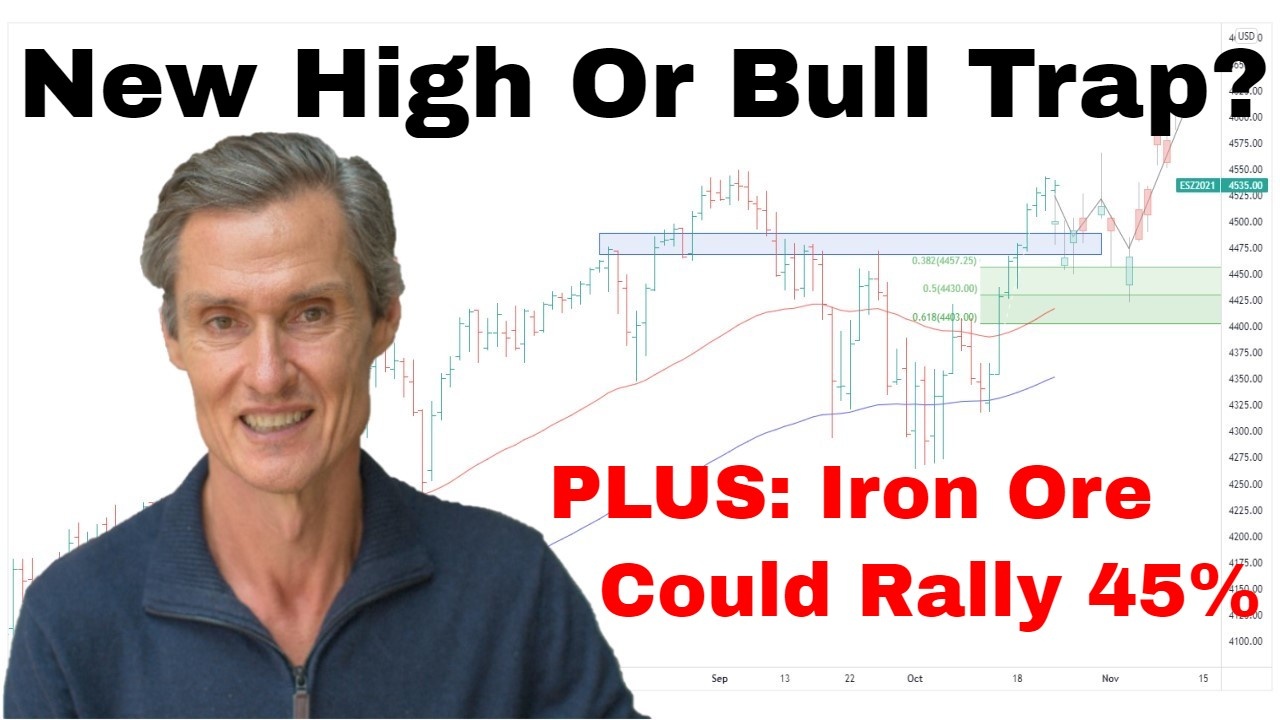
Trade the Trend | Episode 19
By Jason McIntosh | Published 10 December 2021
Trade the Trend is a weekly video focusing on where the stock market is going. It’s for investors and traders looking for insights to the market’s next move. Jason uses technical analysis and trend following techniques to help you piece together the world’s biggest puzzle.
Where is the Stock Market Going?
00:00 Intro
00:20 Where is the S&P 500 going?
03:07 Where is the Dow Jones going?
05:07 Where is the Russell 2000 going?
08:26 What a stock market correction may look like
11:58 Where is the ASX 200 going?
14:40 How I’ve been hedging
17:09 Could iron ore rebound?
Where to invest now?
Looking for ASX stocks to buy now, as well as off the radar ideas most people don’t know? Our algorithms scan the stock market daily for medium term investment trends. We then tell our members precisely when to buy shares. And most importantly, we tell them when to sell.
If you’re ready to get started, try a no obligation FREE 14-day trial of Motion Trader, and see what an algorithmic trading approach could do for you.
Transcript
Please note: Charts available from video
Welcome to this week’s edition of “Trade the Trend,” a weekly video discussing where the stock market is going. I’m Jason McIntosh. It is Friday, the 10th of December, 2022. As always, this is a general commentary and doesn’t take your personal situation into account.
All right. With that said, let’s jump over to the first chart. Okay. Well, we’re starting with the S&P 500. Well, look, I think a really interesting situation has been developing over the last few weeks. And the S&P 500, when we look at it on this chart alone, it looks quite constructive and the NASDAQ does as well for that matter.
So, let’s just start looking at what the pullback has given us. I’m going to start by putting some Fibonacci levels on. So, these are really good for getting an idea of how deep a retracement has been and working out where a market could rally from. And we put that on like we measure this whole move up from the October low.
The market has come back to the 50% retracement level. So, that’s pretty much textbook stuff for a market which is in a bullish trend. You’ll get these pullbacks at the 50% level, and then you’ll get a rebound or a rally off it.
And so, look, that’s what the S&P has done. The NASDAQ has done something very similar. And now these markets are closing in on their all-time highs. So, on that measure, you’d say, “Look, things are looking good.” The thing is, though, a lot of this is due to the strength of the mega-cap tech stocks, and they’ve largely been propping the market up.
And they have a lot of influence when you look at the S&P 500 and the NASDAQ. What I’m seeing when I look across the other indices and other global markets is that we’ve got a bit of a split going on.
So, on one side, we’ve got those mega-cap tech stocks, you know, the likes of Apple, of Microsoft, of Google. They’re trading up near their all-time highs.
And even this week, Apple actually made a new all-time high. So, they’ve been very strong. But then the rest of the market has generally…well, look, it’s generally not as strong. And there’s quite a bit of variation and quite a bit of variation in the breadth of the market.
So, for instance, if we look back, say, about a week-and-a-half, there were 43 S&P 500 stocks which hit 52-week lows on the same day. Now that’s the most since March 2020. That’s when the COVID crash bottomed. And so, look, that’s not what you’d expect when a market is nearing its all-time highs.
There’s quite a bit of conflicting cross-current, I think, you could say within the markets. You got, you know, the big mega-caps hitting all-time highs, but then you got other stocks, other big companies in the S&P 500 hitting 52-week lows.
So, you got these conflicting signs going on. And so this… Look, I’m seeing this disparity really playing out across the indices when we go through and we look at them.
So, look, the next one I want to have a look at, I want to go over to the Dow. And the Dow is an interesting one to look at because it’s not as strong as either the S&P 500 or the NASDAQ, and that’s largely because it’s got a lot less influence from those big mega-cap stocks.
So, Apple and Microsoft are members of the Dow, but that other cohort of tech-based stocks are largely absent, so it doesn’t get the same sort of lift from tech as the S&P and the NASDAQ. And so if we look at this rally from the October low, look at the pullback and the pullbacks erased pretty much all of that rally we saw in October and November.
And then if we go across and we look at something like the Equal Weight Dow, now this is interesting because the Equal Weight Dow takes out the market cap influence. So, it’s valuing each stock at the same value. And what’s interesting here is when you look at the market on this basis, so there’s our October low, bring that across.
And we actually made a new low a couple of weeks ago. So, it’s a very different picture to what we saw when we looked at the S&P 500 or the NASDAQ which are back at the…they retraced 50% of this rally, but the Dow Equal Weight has retraced the whole thing.
In fact, look, the Dow Equal Weight actually looks a lot more like the ASX 200 in that it’s got more of this sideways, sort of, trading price action over the last few months, and it’s come right back and has tested support through here very much like the ASX 200 has done.
So, you’re getting a very different picture when you’re looking at the Dow to the S&P 500.
If we keep going through the U.S. indices, so say we now go and look at the Russell 2000, which you know I like to look at. Like, the Russell is a really interesting one because it’s the U.S. small caps. So, it’s got 2000 U.S. small caps.
And when we talk small caps, well, in the U.S. they’re actually pretty big companies. They range from something like $100 million through to $2 billion. So, they’re big companies, but they make up, you know, the backbone of, really, the U.S. economy, I think you could pretty much safely say.
And so, look, what we had from here, look, if you’ve been watching for a few weeks, you’d know that we had this breakout of this nine-month trading band, had the breakout here, had the breakout here. We started to get a rally. We’ve got a little bit of a pullback.
This is all looking good. It was all looking very constructive and I thought these were bullish signs for this market.
But then the market then caved in and broke back below the breakout point and we had this heavy fall back towards the support at the base of the range, which comes in down around here or pretty much came all the way back. So, that actually had quite a lot of technical damage. This fall we’ve had through here did a lot of damage to this picture.
And it’s…Look, you might remember me telling you last week that from this point here, this 52-week high, this was the fourth fastest pullback to a 10% correction in the Russell 2000’s history. And in previous times this has occurred it’s taken several months for it to consolidate before it’s gone on and regained its momentum. And that’s in the best case.
And the worst case has just led to these big declines, which could have lasted for a year or so. I don’t think that’s where we’re heading, but it does often require some work before you get moved back up.
So, I think we’re seeing a real split developing in the markets. And so there’s no dominant and there’s no consistent theme. When you look across, like, from the NASDAQ all the way down through the Russell, there’s not that consistent theme. And look, I want to say this, and I think this is really important. I’m not suggesting that we’re…the bull market’s open, we’re heading into a bear market.
The bear market is something where you look for stocks to decline 20%, might last 6 to 12 months. I don’t think that’s what we’re looking at. But I definitely think there’s the potential that we’re going to see these markets consolidate a bit more maybe over the next few months.
And look, I wouldn’t rule out the possibility that where…this 10% to 15% correction that has been spoken about for a while now, that this 10% to 15% correction, it really could be…actually, this could be the start of, like, that broader consolidation that we know is coming somewhere on the horizon and that horizon, actually we now could be at that point.
So, again, it doesn’t mean it’s a bear market, but it does mean we are in for a period of maybe choppy trading where we do get rallies, we do get declines, but we don’t actually go a long way. It’s a lot of back and forth and chop and zigzag and just difficult trading conditions.
Now, I just want to jump back to the S&P 500 for a moment. I’ll show you what I mean. Let’s just get rid of that. Now, I’ll give you an example. So, let’s just go back to…I’m going to go back to 2013, 2014. And I’ll show you what I mean the sort of thing which could happen.
Of course, this doesn’t mean it will happen. It’s just what could happen. So, where are we? I’m looking for…I’m looking for this period in here.
So, what we saw here, we saw…So, the market had been…not dissimilar to what we had over the last year. The market had a strong period up through here. And let’s just expand that out a bit. The market broke to a new high. And then we had…actually, yeah, then we had a move down.
We had a quick rally back like we’re having now, and then we had another pullback. And then the same sort of thing happened about 12 months later through here.
So, we had the market at a high. We had a pullback. We had a quick rally back up to a new high. And then the market rolled over again and went down for a deeper correction, so, the zigzag. I call this an ABC zigzag correction.
And look, this could be what we’ll experience over the next few months. Of course, I could be wrong in this. Maybe the market is just going to continue to rise. But let’s just jump back to where we are now and drawing what could happen if this were to play out like those periods, which I showed you before, which I’ve seen happen many times in markets.
It doesn’t always pan out, but it does happen quite a bit. So, you have the initial leg down, you get the quick strong rally back maybe to a new high, maybe just below it, say were to make a new high, and then maybe you get a C leg down for your zigzag.
And if you measure out something like that, just to give you an idea of percentage, like, that could bring you back to a 10% correction. A 15% correction would require something a little bit deeper. But that’s a possibility. It’s not a prediction. It’s not a certain thing that could happen. Again, this is a long-established bullish trend.
And you don’t want to bet against the bull, but you do need to be aware of possibilities that could pan out. And that’s certainly one of them. And with that divergence and those undercurrents of confusion we’re seeing when we look through the indices that we’re not seeing the confirmation of a strong rebound across the Dow and across the Russell, it makes me think that maybe this is what could develop over the weeks ahead.
But look, it’s going to be interesting to see whether that actually happens.
So, let’s jump over and have a look at the local market. And look, and by the way, if you’re getting some value out of these videos, please hit that like button, let YouTube know that you’re enjoying them, and also please leave a comment even if it’s just, “I like the video,” because that also sends YouTube a good signal and YouTube will then show other people because you’re engaging with the video and you’re liking it, other people are watching.
The people are watching, well, I keep making them. That’s how it goes.
Okay. Local market. Now, this is the ASX 200. Now, this is really interesting because there’s a really…there’s a great pattern which has been developing, which is really starting to, like, firm up just over the last couple of weeks. We have what is called a symmetrical triangle. And this is one of my favorite chart patterns. So, let’s just draw it in on the chart.
So, these blue converging lines, it’s what’s called a triangle. And you can see why because it looks pretty much like a triangle when you look at it. So, triangles are interesting. They’re one of my favorite patterns because they’re actually one of the most reliable of the chart patterns, which I’ll look at. They often work. Sometimes they fail. Everything fails sometimes. But these have a higher strike rate of actually playing out.
And they’re often continuation patterns, which means…well, a continuation pattern would be, well, as it sounds, the market continues. So, if this pattern were to act as a continuation pattern you’d expect to see…textbook would be you’d have one more decline. So, they’re working like in five legs. So, let me just get rid of that for a sec. So, you’d go A, B, C, D, E. So, that’s five legs counted in alphabet.
That’s how the textbook pattern would work so you’d have a little bit more of a pullback, and then you’d have a breakout, return move, and then off and away. That’s a bullish scenario. Could that happen? Well, look, absolutely it could happen. It does allow for some more weakness if the U.S. markets were to pull back, but then you could get the continuation.
That’s the bullish side. Well, look, that’s what we’d all like to see happen. Whether it happens or not, we don’t know because we don’t want to preempt what’s going to happen. Preempting these breakout points is, yeah, it’s tricky. And when you preempt things, often you can be wrong. I prefer to wait for the market to show its hand. Will it break to the top side? I don’t know.
That’s a continuation pattern, but sometimes they’re also reversals. And that means that we may not get that break to the top side, maybe this is going to, you know, in with the downside move, so you could get the, you know, move towards the lower and up, and then you get the breakdown, and then we do get that larger, sort of, correction coming in.
It’s definitely a possibility. And that’s what this is all about. It’s about identifying the possibilities. What could happen? What could the markets do over the next few months? And then applying strategies to work with those possibilities.
So, at the moment, we’re in the neutral zone. We don’t know. We want to give the bull the benefit of the doubt. And that’s the way I approach things with my trading strategies and that’s my service. My Motion Trader service, it uses wide trailing stops.
The idea of wide trailing stop is that you can ride these big upward trends and when you go into the sideways period, if you got a wide trailing stop if you watch where the pointer is, a wide trailing stop could travel below here, let the market consolidate.
If it breaks out, then the wide trailing stop continues up underneath it. That’s how you can stay with these big longer-term trends. If the market does break down, well, then it hits your trailing stop and it gets you out. That’s how it works out.
So, look, I know I painted a bit of a cautious picture with the U.S. markets, but that cautious picture may not play out. We could get the more positive side. So, look, it’s just going to be interesting to see how this develops over the next few weeks. There’s a…Look, I told you last week I did a little bit of hedging and I did a little bit more hedging during the week.
So, let’s jump quickly to…let’s try a four-hourly chart just for a little bit more detail. So, I did a little bit of hedging here a couple of weeks ago. And then last week I did some hedging…or during this current week is probably around Tuesday I did some hedging here as the market came up. And it just got to…we’ve got some resistance up through here.
So, just as the market got to the resistance point, I did a bit more hedging because, you know, I was concerned that we could get this leg down, but we didn’t. The market initially did come down, then it broke up.
So, once we got back here, I covered half my hedge. So, I am still carrying a little bit of hedging, but not much because we’re getting this strength back in the market. And maybe something bullish is going to come out of this. We just don’t know at the moment.
So, I’m long the market, I’ve got a little bit of hedging, I’ve got the wide trailing stops. And that’s very much how I’m playing this. I’m long, but I’m cautious. I’m mindful of the divergence we’re seeing in some of those markets. But, look, I want to give the bull the benefit of the doubt.
So, then we think, “Look, what could be a catalyst? What could be a catalyst for the market to break higher?” And one of the interesting markets I’ve been looking at this week, if we jump quickly over and have a look at the iron ore market, because this is…It looks really interesting where it currently is because you’re starting to see this rebound off the low. And the rebound is starting to look quite constructive.
One of the things I like to do when you have a big market fall, you get a…Look, it’s been a pretty diabolical market, really. It’s gone from an all-time high and it fell 60%. So, that’s a 60% fall in 6 months. What often happens when you get these routes in a market where you just get this consistent and heavy selling and eventually the selling exhausts itself and it’s come so far, so very far that you get a strong rebound because the market just gets so oversold, gets so overstretched that you get a strong snapback.
You think about, like, a bungee cord. If you’ve ever done a bungee jump, which I did back in my younger year, I did a bungee jump, and you’d go over and the cord gets stretched, stretched, stretched, stretched, gets so overstretched and taut that you actually stop for a moment and then you quickly rebound in the opposite direction.
It doesn’t mean you’re going back to where you jumped off. And in a market, it doesn’t mean you’re going back into a bull market, but it does mean that you have a strong rebound, then maybe it rolls over again, maybe it doesn’t. Maybe it does go into a new bull market. You don’t know. That’s not what we’re looking for at the moment.
That’s getting ahead of ourselves. But we’re just looking at could this market strongly rebound? And the answer is, it definitely could. So, if you put some Fibonacci’s on this, this is a great way to see how a rebound could work.
So, this is really interesting. So, iron ore is currently trading at around $106. And you look at the Fibonacci’s, the 38.2% is at $140. And then the 50% is up here getting up towards $160. So, that’s something like 30% to 45% higher than the market currently is.
So, that’s a big rebound. So, a lot of people would look at that and go, “No. No way. No way it could rebound. That March is all…too many problems in China. I don’t think the market could rally that far.” But that’s what a rebound from a deeply oversold condition can do.
I’m going to give you an example where that’s actually happened. So, it happened recently. It’s happened many times. I’ve seen this so many times. But it’s just happened in the last year. If we look at the lumber futures. So, we had this big boom in Lumber. This is during COVID.
So, there was supply shortages. There was increased demand from homebuilding in the U.S. and there was also speculative buying as well. So, it had this huge…you know, it had this monster rise, really big rise in lumber over a period of around six months. And then it got ahead of itself and we had the collapse.
So, this is about a 70% fall over a few months. It’s not dissimilar to what we saw on iron ore. And at this point here people would have been saying, “Well, there’s no way. No way this could rally. It has come so far.” But as I say, quite often you get the strong rebound.
Put the Fibonacci’s on it, and look at that. It’s come up from a seemingly impossible position at $446. It has…well, it’s kind of doubled. It’s doubled off its low up to the 38.2% retracement.
So, look, this can happen. And so what makes it interesting with iron ore is that you look at the makeup of the S&P to…not the S&P. The ASX 200. BHP, Fortescue, and Rio make up about 9% of the index. So, look, that could give the market some sort of a tailwind. Maybe that could be a catalyst for breaking out of that triangle pattern.
Just out of interest, it’s something we want to watch, a situation we want to be aware of. I’m not playing the iron ore producers from the long side. The moving average is still down.
I don’t really play these moves, but they’re interesting to watch and it’s interesting from the perspective, again, well, what are the possibilities? Could the market rally from here? And maybe there could be a tailwind. It’ll be interesting to see how it play out.
But look, just to sum it all up, I’m not in a hurry to buy this dip that we’ve had in the market and that maybe we continue to get. I want to…Look, I think this is a scenario that says the markets may be difficult for the next couple of months, so I’d rather sit back, watch how it plays out.
If we get buy signals, if the markets get some momentum, well, that’s great. I’m happy to get in.
But until then, look, I’m quite happy to sit back, take that cautious stance, let my longs run with the wide trailing stops, and just watch how this plays out. It’s an interesting market. It’s a market with cross-currents, and they get tricky.
They get tricky from time to time like this. So, look, I hope that was interesting. And look, let’s call that a wrap for this week, and we’ll come back next week and try and put all those pieces back together again. So, until next time, thanks for joining in.
Meet Jason

I'm Jason McIntosh, the creator of Motion Trader. My career began in 1991 on the trading floor at Bankers Trust. Nowadays, I trade my own systems from home in Sydney.
Motion Trader is for investors who value robust analysis, data driven entry and exit signals, commentary, and education. I use engineered algorithms to identify when to buy and sell ASX stocks. No biases or guesswork, just data driven signals.